
An HTTP response header plays a role in the communication between a Web server and a Web browser. The server sends these headers after sending the response to the browser.
Response headers provide information to the browser, including details about the content being sent. They also include the server name, version, date and time of the response cache status, cookies, and more. This information helps improve website speed and performance while ensuring connections and accurate data transmission. Additionally, response headers are essential in content delivery networks as they aid in caching and optimizing content delivery.
In some cases, it may be necessary to check HTTP response headers to ensure the functionality of a Web server is working correctly. By examining the response headers sent by the server, you can gain insights into what is happening. For instance, you can verify if caching is functioning as intended. Here is how Google Chrome developer tools can help display HTTP response headers.
View HTTP Response Headers with Google Chrome
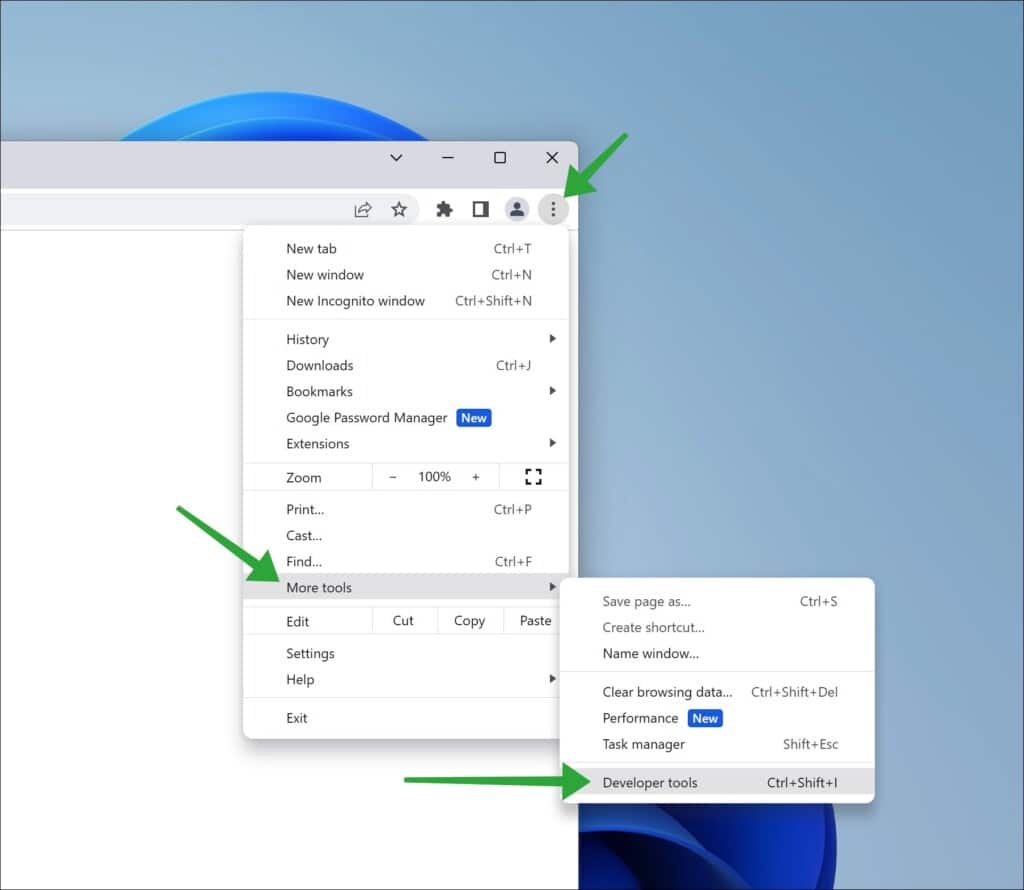
Launch the Google Chrome web browser. Click on the menu icon in the upper right corner. Click “More tools” and “Developer tools” in the menu.
To open the network log, click the “Network” tab first. Open the website and record the network traffic by pressing CTRL + R. In the network log, you will see the results.
In the tab, open the URL whose HTTP Response headers you wish to view. Click on the domain root.
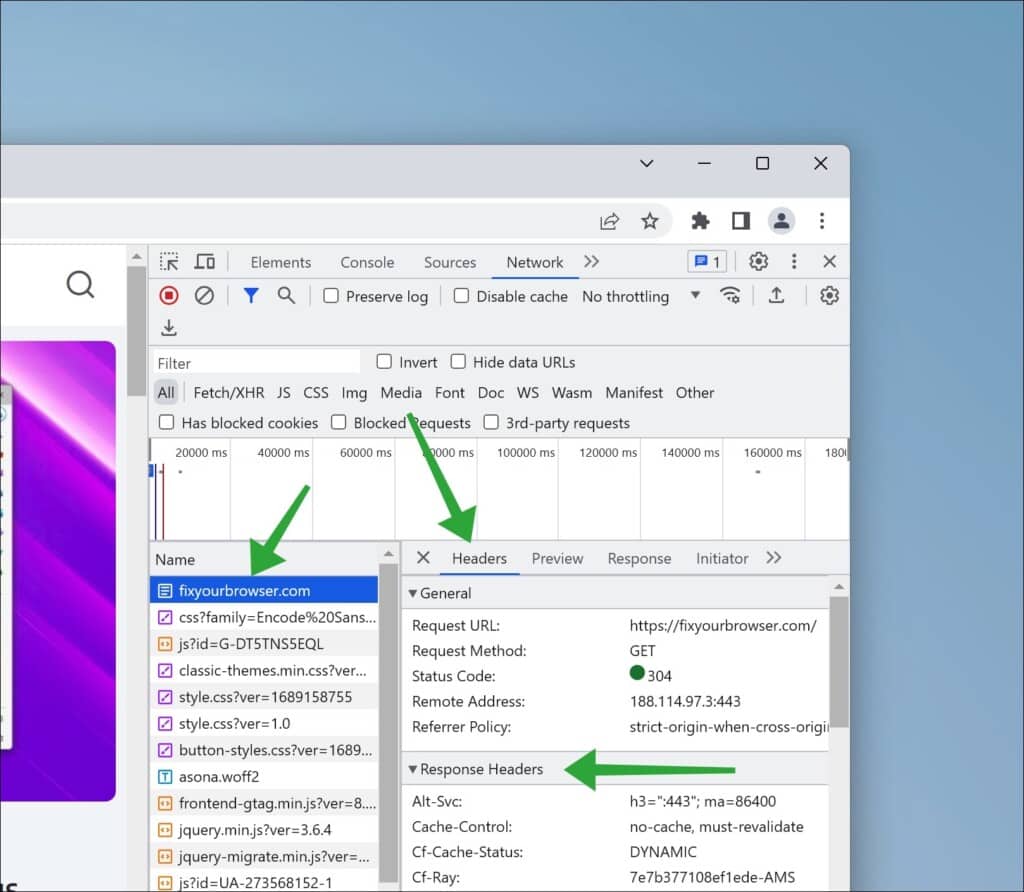
After this, click on the “Headers” tab. You will now see “Response headers” (depending on which language you have Google Chrome installed).
These are the server’s responses to the browser’s HTTP request. The response headers provide the content type, encoding, and server status code. They can also provide security-related information, such as cookies and authentication tokens. This data can be used to help debug web pages and troubleshoot problems. For instance, if you are having trouble viewing an image, the response headers can show the content type of the image, which can help determine if the issue is related to the content type not being recognized or supported by the browser.
HTTP headers browser extension
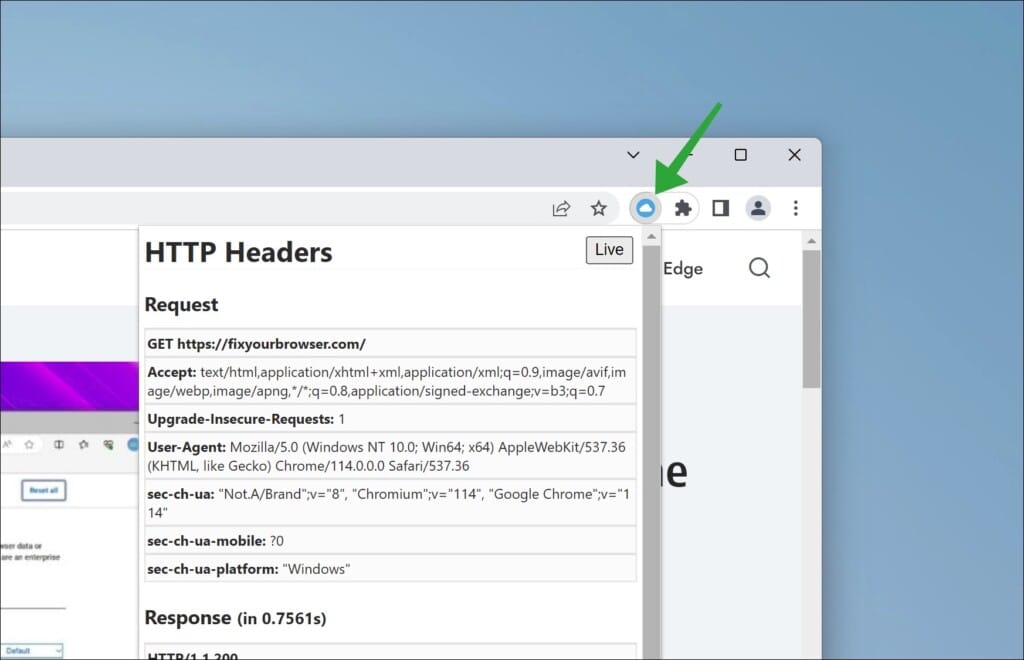
Alternatively, there’s a Google Chrome extension that simplifies viewing HTTP headers. It is known by the name “HTTP Headers“.
It grants you access to the HTTP headers of any webpage you visit. The best part is that it presents the information in a user graphical interface, allowing for quicker and more convenient browsing. I highly recommend installing this free browser extension. Not does it assist in debugging HTTP requests and responses, but it also enables you to monitor the data being sent and received and even verify if a website uses secure protocols. Moreover, it offers a feature for examining cookies and other metadata in the HTTP headers.
I hope this helped. Thank you for reading!
Also, read these 7 BEST security tips for the Google Chrome browser.


