Chrome Developer Tools is an extensive toolkit explicitly designed for developers and integrated directly into the Chrome browser. With these tools, developers can make real-time edits to web pages, expedite problem diagnosis, and accelerate website development.
You can still find value in using Developer Tools even if you are not a developer.
What are Chrome developer tools?
Chrome Developer Tools is a set of powerful tools integrated directly into the Chrome browser, designed to aid developers in various tasks and improve website development. When you open Developer Tools, you will see a panel on the right side of the page containing several tabs:
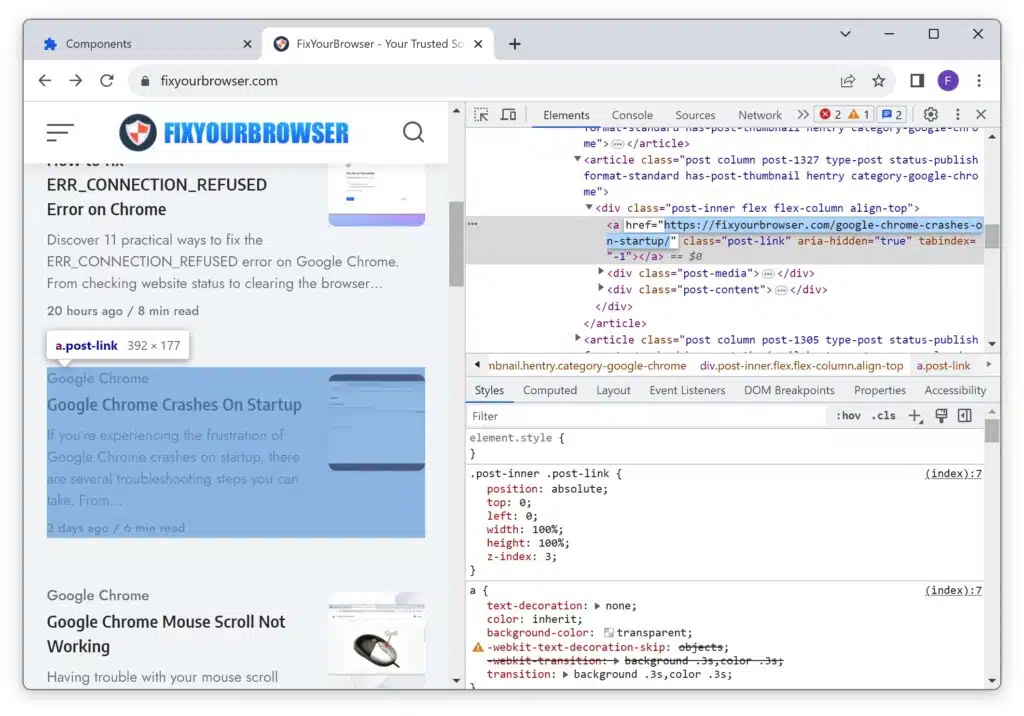
- Elements: Shows the HTML and inline CSS used to construct the web page.
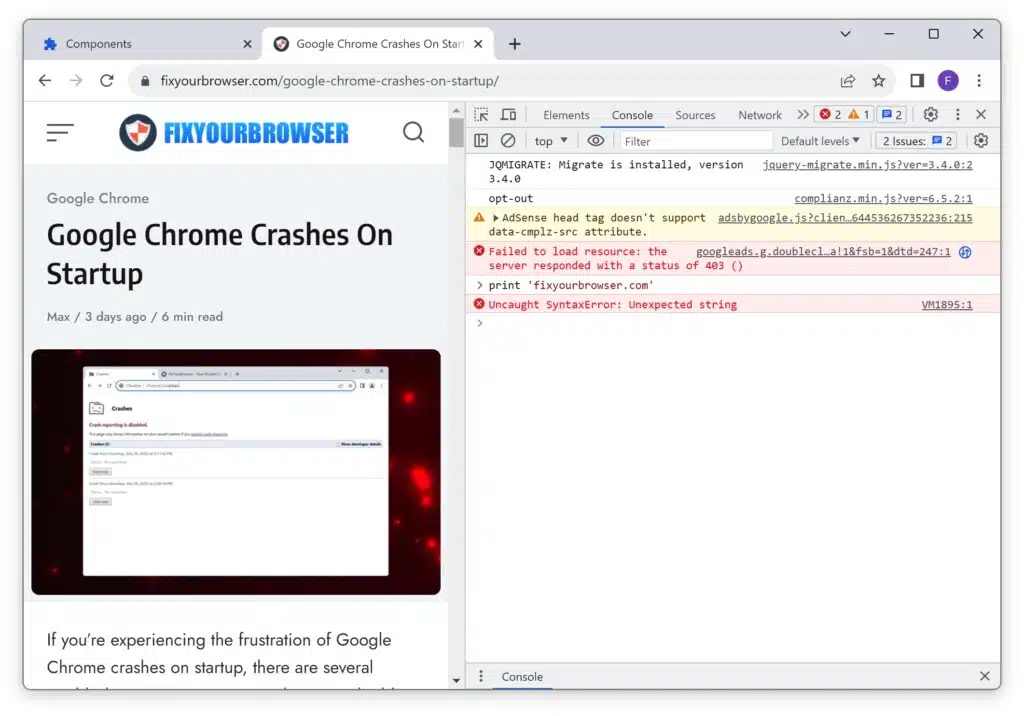
- Console: Deals with JavaScript and provides information about interactive elements on the page.
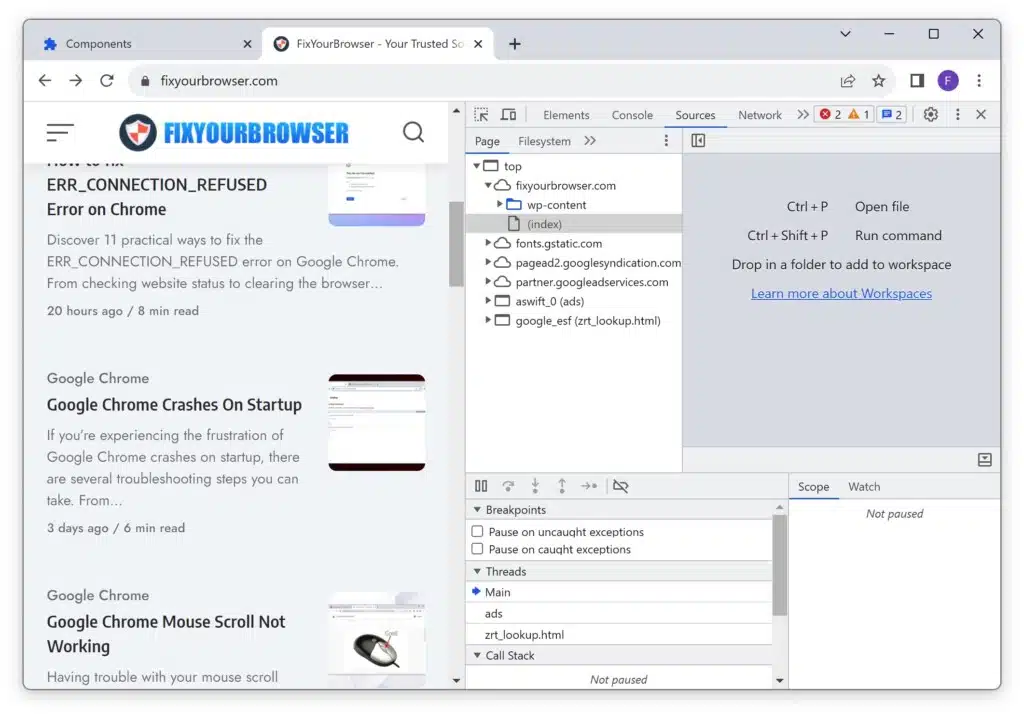
- Sources: Displays and lets you inspect all the files used to create the website.
- Network: Shows all the files loading in the URL you’re viewing, providing detailed information on loading times.
- Application: Reveals browser storage information, including in-browser databases and granular control over cookies.
- Security: Provides basic security information, such as viewing a site’s HTTPS certificate and TLS status.
- Memory: Offers insights into memory usage and performance.
- Performance: Helps developers optimize site performance by generating reports on functionality and structure.
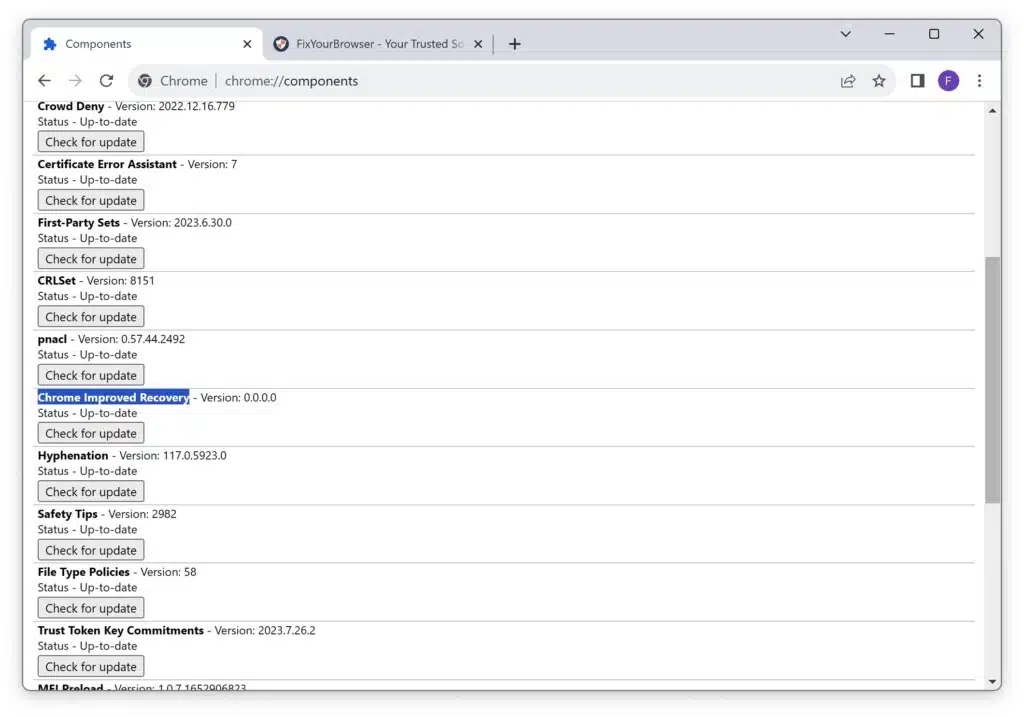
Chrome Developer Tools receive updates with each new Chrome release. To ensure they are up-to-date, access the Components page by typing chrome://components into your browser’s omnibar. From there, select “Chrome Improved Recovery” and check for updates.
It’s essential to understand that Developer Tools won’t allow you to change the code on the actual website. Modifying the site’s backend requires access to the website’s server. Developer Tools only affect the code your browser uses to display the site, making it a risk-free environment even for beginners. When you close the Developer Tools window and return to the website, everything remains as before.
How to open developer tools?
To open Chrome Developer Tools, you can use keyboard shortcuts or access them through the Chrome menu. For instance:
- On Mac OS: Use CMD+Shift+J or CMD+Shift+C.
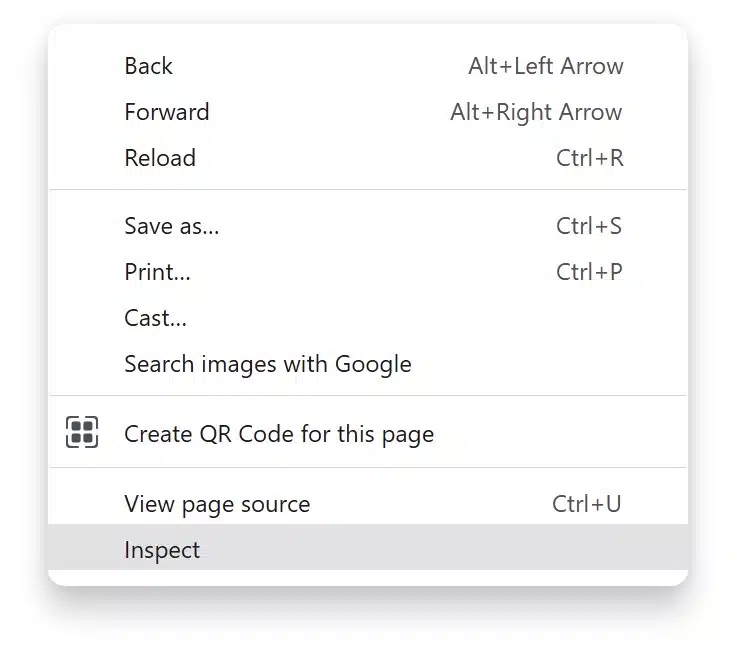
- On Linux, Chromebook, and Windows: Use Ctrl+Shift+J. Alternatively, you can right-click (Windows) or Ctrl-click (Mac) anything on a web page and choose “Inspect” to open Developer Tools.
Accessing Developer Tools directly on Android is impossible when using them on mobile devices. Instead, you can utilize Remote Debugging. The process involves:
- Connecting your Android device.
- Opening Developer Tools and go to “More Tools” > “Remote Devices.”
- Authorizing remote access on your Android device. Unfortunately, there is no direct way to access Developer Tools on iOS devices.
Google Chrome developer tools tips and tricks
Explore Real-Time Editing
One of the exciting features of Developer Tools is the ability to make real-time edits to HTML, CSS, and JavaScript. By inspecting an element you have the option to double-click on the code. Instantly make changes allowing you to observe immediate results. This feature is handy for tuning the appearance and behavior of web elements without modifying the source code.
It’s a way to experiment and see how different styles or code alterations impact the layout and user experience.
Simplified Debugging
Although debugging is often seen as the purpose of Developer Tools, some lesser-known features can significantly streamline this process. You can set breakpoints in JavaScript code, inspect variables and step through code execution line by line. Additionally, a feature called “Event Listener Breakpoints” enables you to pause code execution whenever a specific event occurs. This makes it much easier to trace and resolve issues.
Enhance Website Performance
Developer Tools provides insights into the performance of a website. The “Performance” and “Network” tabs show loading times, resource usage, and areas causing bottlenecks. Utilize this data for identifying areas that need improvement, optimizing file sizes, and reducing loading times.
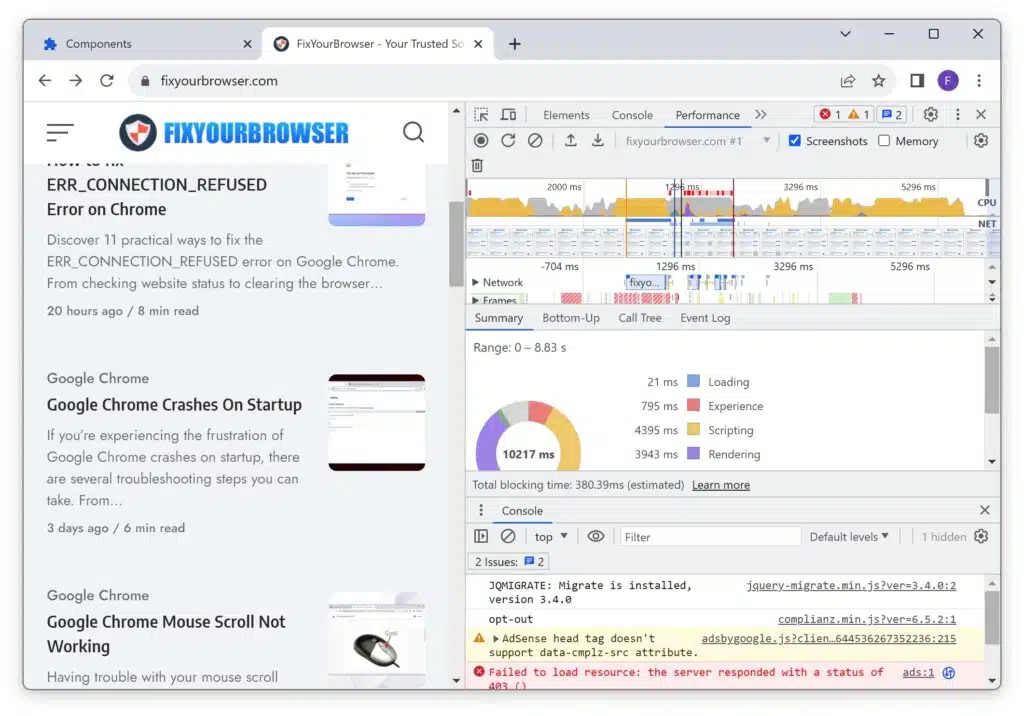
The “Lighthouse” section generates reports automatically highlighting the site’s functionality and structure, helping you improve performance and enhance the user experience.
Become a Command Line Expert
The “Console” section in Developer Tools acts like a command line interface for the web. It goes beyond logging messages; you can use it to execute JavaScript code and interact with the web page in real-time. Whether you want to query DOM elements or test API calls, the Console is a tool that saves time and simplifies the debugging process.
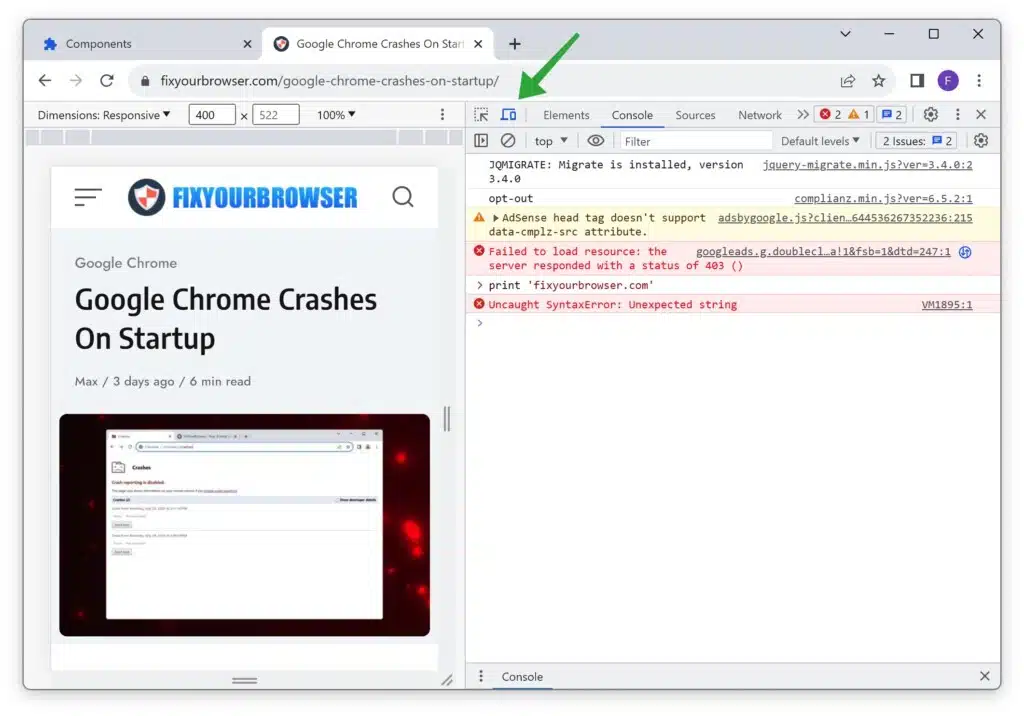
Experience Mobile Device Simulation
Designing websites is crucial in today’s mobile-centric world. With Developer Tools, you can simulate mobile devices and see how the layout of your website adapts to various screen sizes.
Access the “Toggle Device Toolbar.” Use the “Ctrl + Shift + M” keyboard shortcut to choose from various device presets or customize dimensions according to your requirements. This feature ensures your website looks flawless on all devices, from smartphones to desktops.
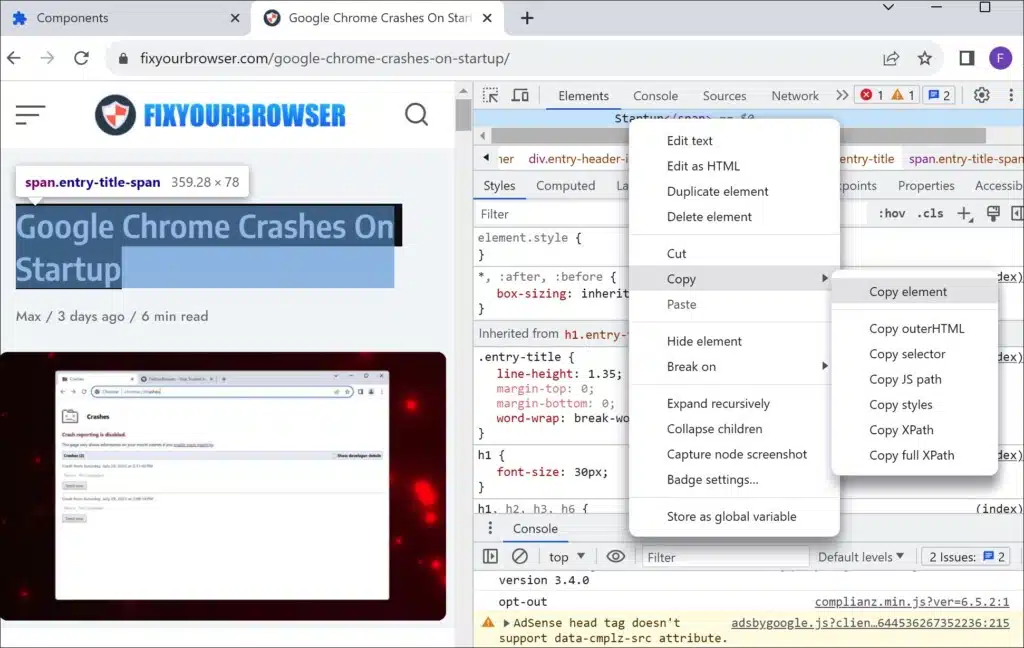
Use the “Copy” Feature
When inspecting elements, you can right-click on any element in the Elements tab and choose “Copy” to copy its entire HTML, including any applied styles. This can be particularly helpful when creating or replicating elements in your code, saving you time and effort.
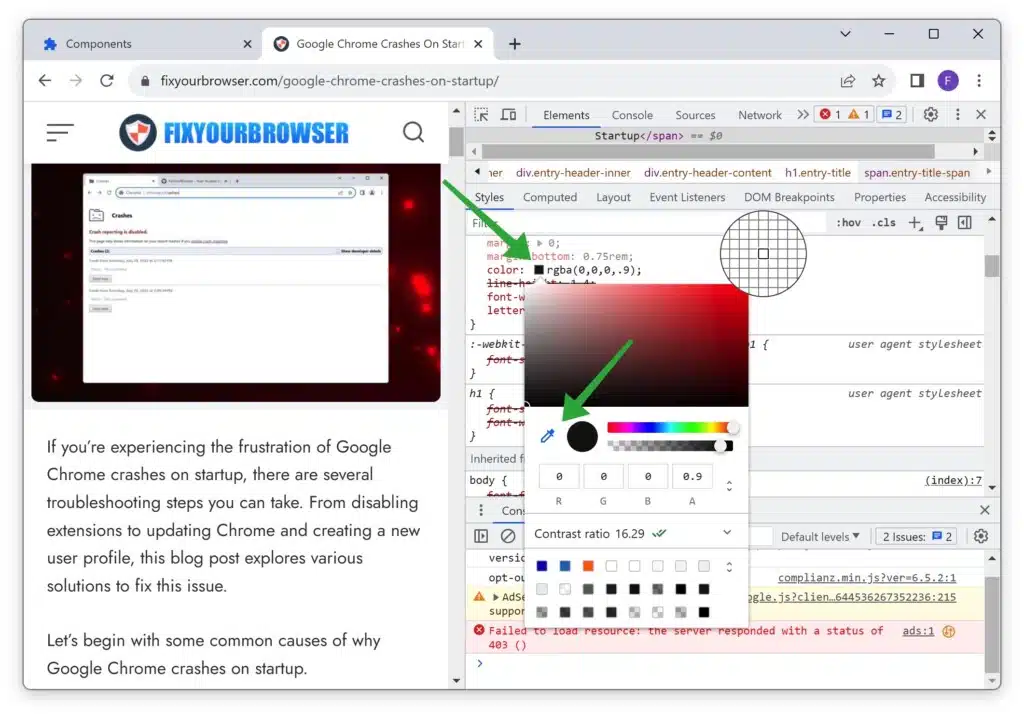
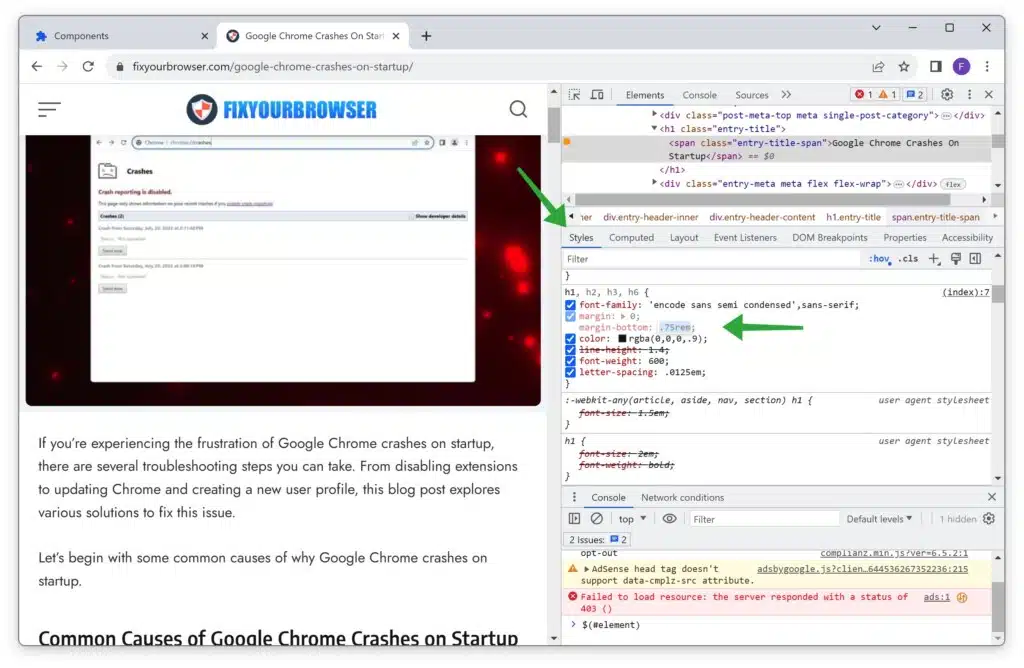
Color Picker
The “Styles” panel in the Elements tab has a handy color picker tool that allows you to visually select and copy any color used on a web page. This feature simplifies the process of matching colors and ensures consistency across your website’s design.
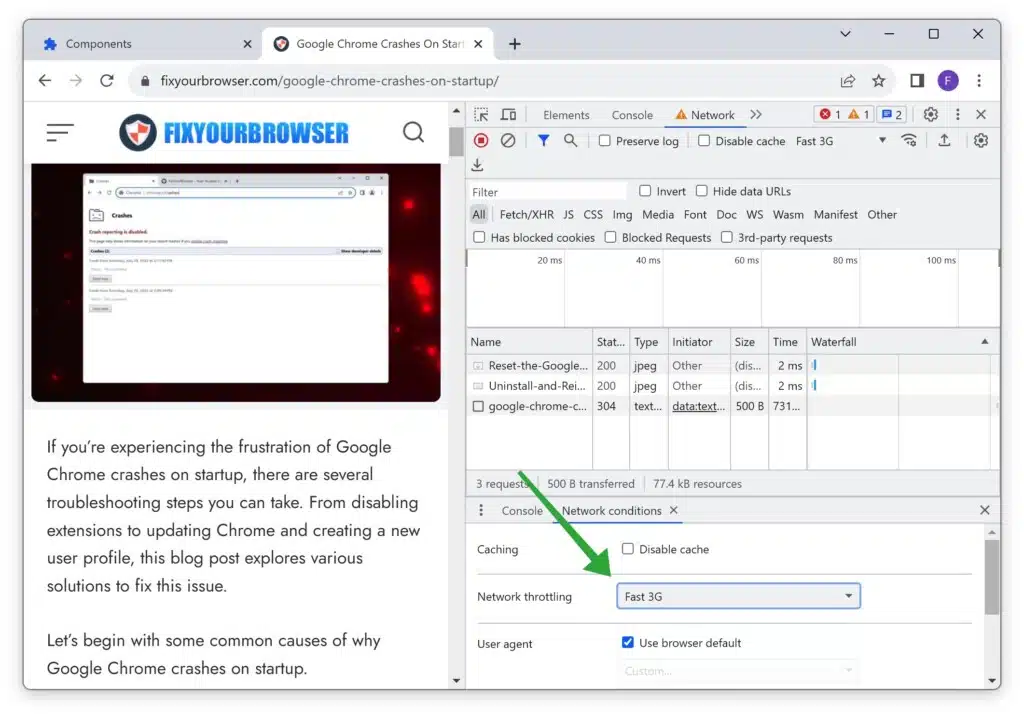
Emulate Various Network Conditions
The “Network” tab not only shows you the resources loading on a page but also lets you simulate different network conditions. To understand how your website performs under different network conditions, you can emulate various connection speeds, such as 3G, 4G, or offline mode. This helps you optimize your site for users with slower internet connections.
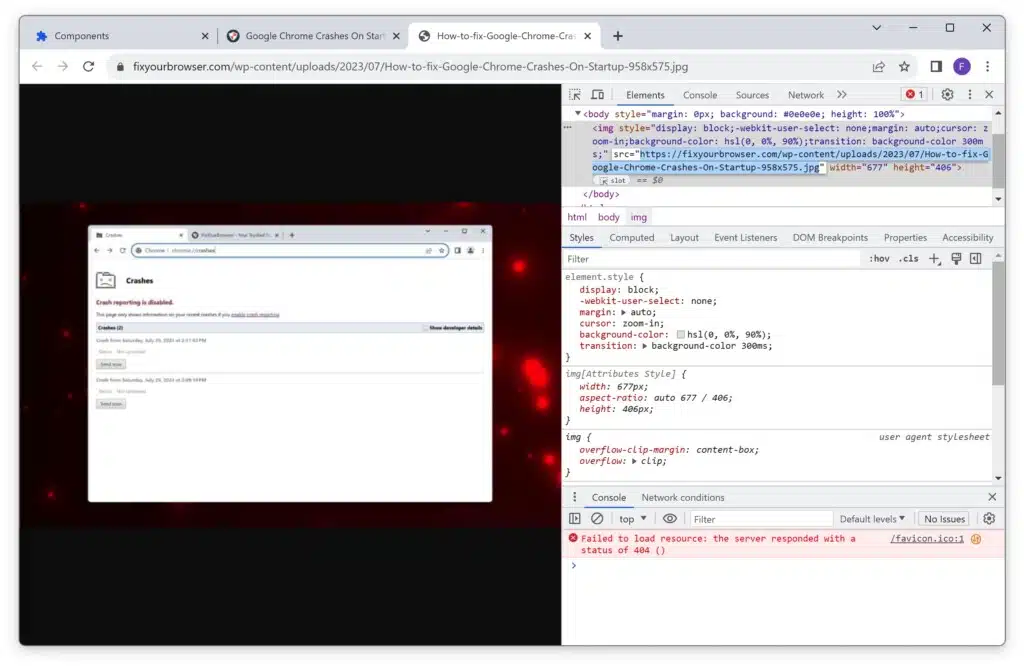
Edit Images in Real Time
You can edit and manipulate images directly within Developer Tools. By right-clicking on an image and selecting “Open image in a new tab,” you can edit the image URL to open it in an image editor. After making the necessary changes, save the image, and your edits will be applied to the web page.
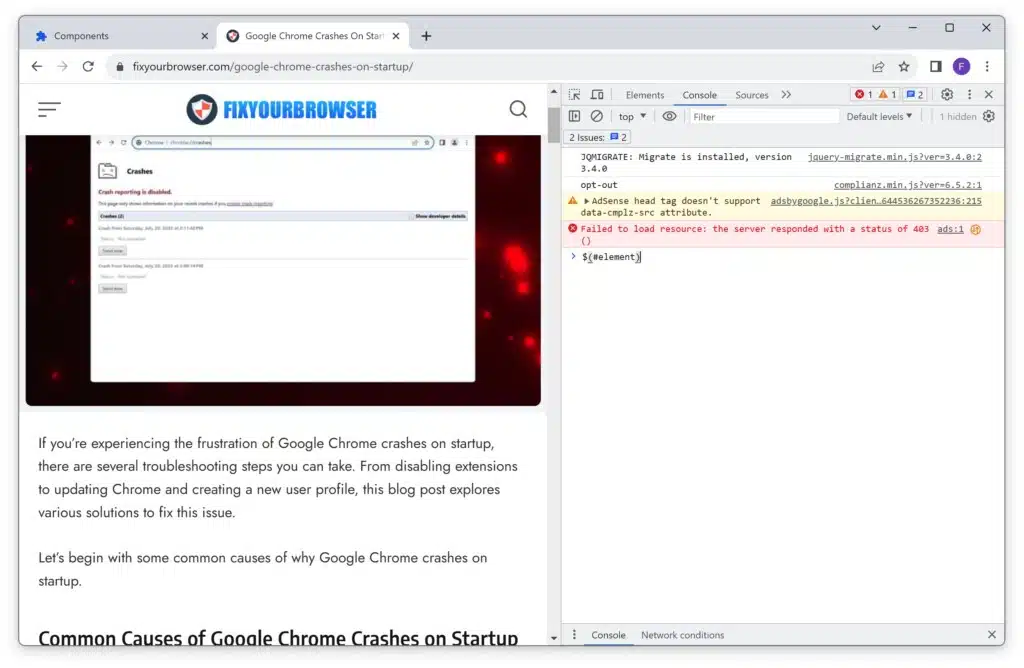
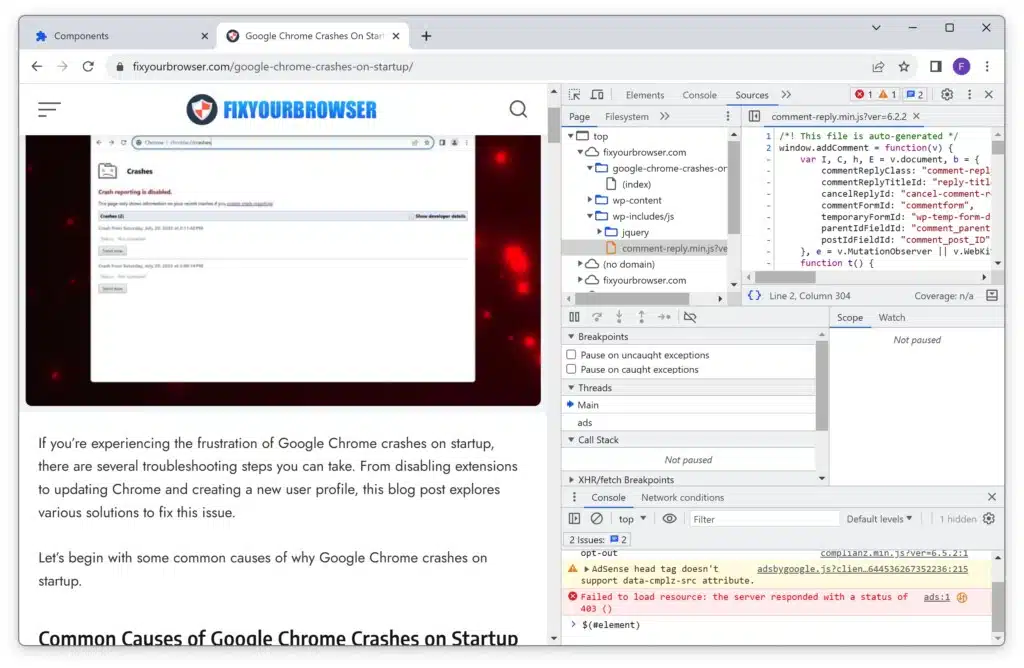
Use $() to Select Elements
You can use the shorthand notation $() in the Console tab to select DOM elements. For example, if you want to select an element with a specific ID, type $(“#elementID”) in the console and press Enter. This quick selection method can be convenient when testing and manipulating elements.
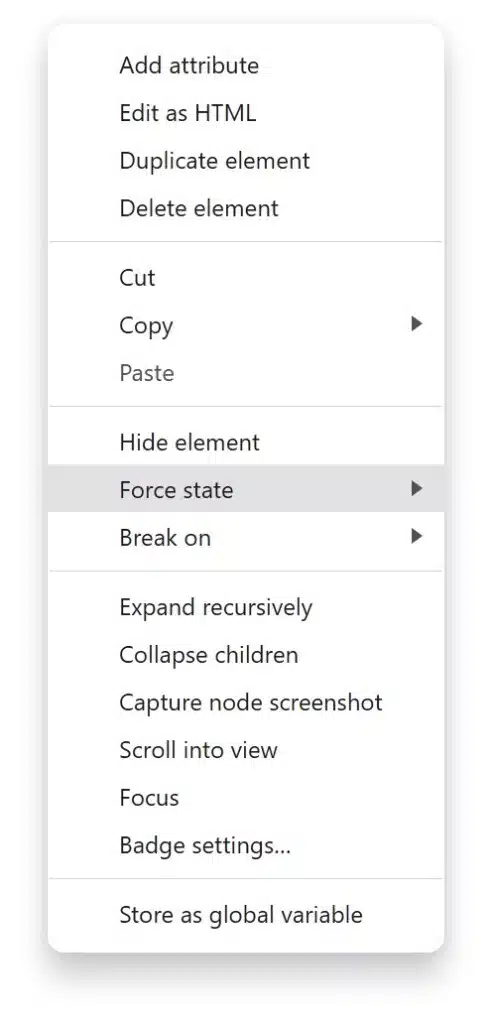
Visualize CSS Box Model
By hovering over an element in the Elements tab and right-clicking to select “Force State,” you can visualize the CSS box model. This feature outlines the element’s dimensions, padding, border, and margin, making it easier to understand and adjust the layout.
Disable and Edit CSS Styles
The “Styles” panel lets you disable or modify CSS styles in real-time. This can be useful for experimenting with different styles and quickly identifying which styles affect some aspects of your page.
Edit JavaScript Values
In the “Sources” tab, you can override JavaScript values directly. Locate the variable you wish to modify, right-click, and select “Edit Value.” This lets you test different scenarios without having to rewrite the code.
I hope these developer tools, tips, and tricks helped to improve your developer skills. Thank you for reading!
Read more: 7 BEST security tips for the Google Chrome browser.