In Google Chrome, there are internal commands available for debugging purposes. By using these URLs you can mimic crashes and memory problems. These internal commands are primarily meant for developers to assist in troubleshooting any issues that may arise while users use the Google Chrome browser.
Please note that these URL commands are not meant for users and should only be utilized by developers or individuals with a comprehensive understanding of browser internals and debugging procedures. It’s also important to keep in mind that the functionality of these commands may change in versions of Google Chrome.
Google Chrome internal URLs for debugging purposes
If you do not know, which I guess you do know, but just in case. You should enter the following command(s) in the address bar.
chrome://badcastcrash/
The chrome://badcastcrash/ command is a debugging feature that allows developers to simulate a crash caused by bad typecasting or improper data conversion within the browser’s code. By triggering this command, developers can identify and fix issues related to incorrect data handling, ensuring a more stable and reliable browsing experience for users.
chrome://inducebrowsercrashforrealz/
The chrome://inducebrowsercrashforrealz/ command serves as a tool for developers to crash the browser in a controlled manner intentionally. While this may seem counterproductive, inducing browser crashes is crucial for testing and debugging. It helps developers identify the root causes of crashes, isolate problematic areas in the browser’s code, and improve its stability and performance.
chrome://inducebrowserdcheckforrealz/
The chrome://inducebrowserdcheckforrealz/ command is designed to trigger a browser crash while performing deep checks in the browser’s code. By running this command, developers can evaluate the robustness of their code and identify potential vulnerabilities that could lead to crashes. It aids in fortifying the browser’s defenses against unexpected errors and ensures a more secure browsing environment for users.
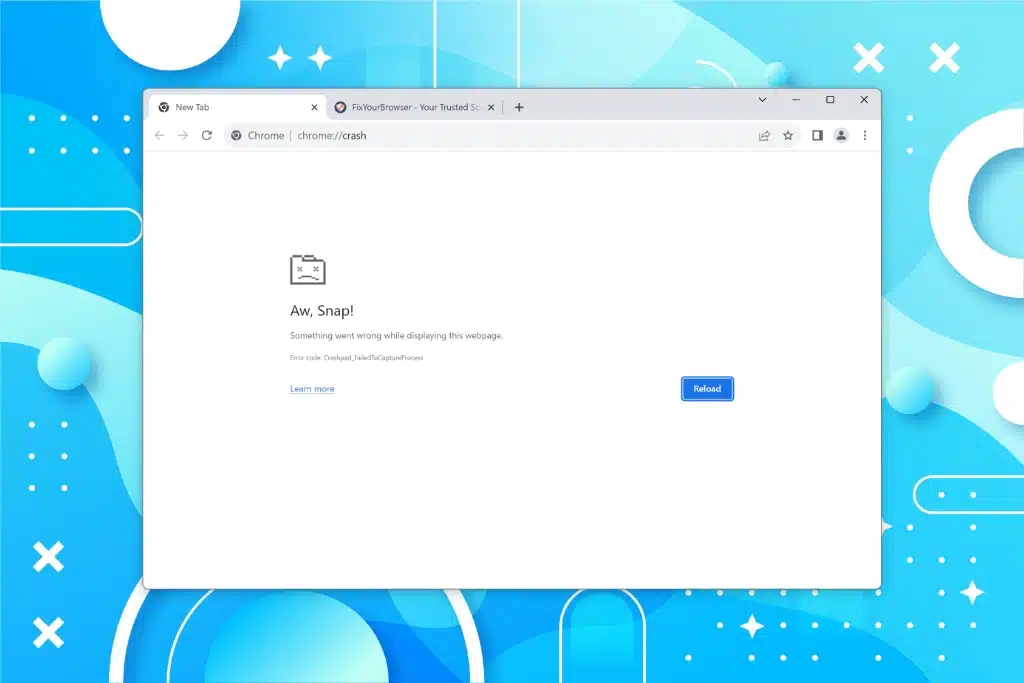
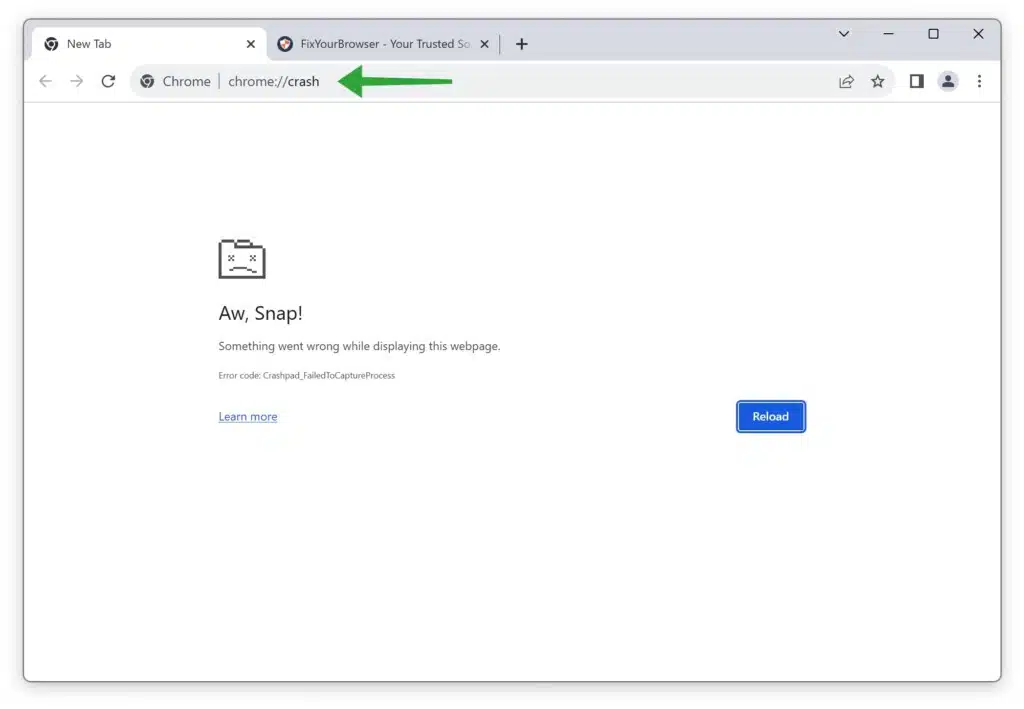
chrome://crash/
The chrome://crash/ command is a debugging utility that causes the browser to crash “aw snap” intentionally. This feature allows developers to obtain crash reports and analyze the browser’s state during the crash. By studying these reports, developers can detect and address the root causes of crashes, leading to more stable and reliable browser performance.
chrome://crashdump/
The chrome://crashdump/ command generates a crash dump, a snapshot of the browser’s memory and state at the moment of a crash. This is a valuable resource for developers to investigate complex crashes that are difficult to reproduce. By analyzing crash dumps, developers can gain insights into the precise conditions and variables that led to the crash, facilitating effective debugging and problem resolution.
chrome://kill/
The chrome://kill/ command is used to terminate or quit the browser process forcefully. While this might seem harsh, it is essential for testing scenarios where the browser becomes unresponsive or hangs. Using this command, developers can simulate abrupt termination and study the browser’s behavior during such situations, allowing them to identify potential issues and develop appropriate solutions.
chrome://hang/
The chrome://hang/ command is utilized to simulate a browser hang or freeze intentionally. This feature is handy for developers to investigate and debug issues related to unresponsiveness. By triggering browser hangs, developers can identify the root causes of freezes and implement optimizations that improve the browser’s responsiveness and overall user experience.
chrome://shorthang/
The chrome://shorthang/ command is similar to the chrome://hang/ command but is intended to cause shorter periods of unresponsiveness. This allows developers to quickly test how the browser recovers from temporary freezes and identify potential bottlenecks that might affect real-time user interactions.
chrome://gpuclean/
The chrome://gpuclean/ command provides developers with a means to clean or reset the state of the GPU (videocard). By running this command, developers can resolve certain graphics-related issues that might arise during browser operation. It allows the browser to start with a clean GPU state, potentially mitigating rendering problems and enhancing overall graphical performance.
chrome://gpucrash/
The chrome://gpucrash/ command triggers a controlled crash related to the GPU or its rendering processes. While inducing a crash might sound counterintuitive, this feature assists developers in debugging GPU-related issues. By analyzing the crash reports and logs, developers can pinpoint the source of GPU-related errors and implement necessary optimizations to ensure smoother graphics rendering.
chrome://gpuhang/
The chrome://gpuhang/ command is designed to simulate a hang or unresponsiveness caused by the GPU. By triggering this command, developers can investigate GPU-related performance problems and identify areas for improvement. This helps create a more stable browsing experience, especially for tasks that rely heavily on GPU resources, such as rendering complex graphics or running WebGL applications.
chrome://memory-exhaust/
The chrome://memory-exhaust/ command artificially exhausts the browser’s memory, simulating a memory-intensive scenario. This valuable testing feature allows developers to assess how the browser handles memory pressure and recovers from memory-intensive operations. By analyzing the browser’s behavior under these conditions, developers can optimize memory management and prevent potential crashes or slowdowns caused by memory exhaustion.
chrome://memory-pressure-critical/
The chrome://memory-pressure-critical/ command creates a critical memory pressure scenario in the browser. This testing feature enables developers to evaluate the browser’s performance under severe memory constraints. By analyzing its behavior during critical memory pressure, developers can optimize memory usage, prioritize essential tasks, and prevent out-of-memory crashes.
chrome://memory-pressure-moderate/
The chrome://memory-pressure-moderate/ command simulates a more moderate memory pressure scenario. By triggering this command, developers can assess the browser’s response to moderate memory limitations. Understanding how the browser behaves under such conditions helps implement memory-efficient strategies and enhance overall performance and stability.
chrome://quit/
The chrome://quit/ command is a simple but effective tool to close or quit the browser. It can be helpful during debugging sessions when a clean exit from the browser is required. Developers can use this command to quickly terminate the browser process and analyze its behavior upon quitting.
chrome://restart/
The chrome://restart/ command is used to force the browser to restart. Restarting the browser can be useful after making configuration changes or applying updates. This command allows developers to verify that their changes persist across browser restarts and ensure a smooth user experience without unexpected behavior.
Learn more: Popups and redirects in Google Chrome explained.